
The Laxfield UK CRE Debt Barometer, with analytics by Elizabeth Martin, was featured in the FT again today. Selected visualisations from the report below!


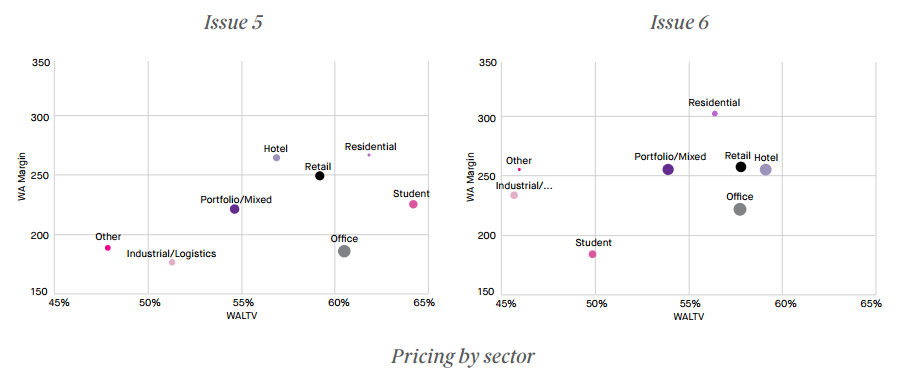
Download the full report here

Embed data-led strategic insight and performance tracking in your organisation, with an automated & interactive dashboard
Data is everywhere and more of our world is quantifiable than ever before. You want to capitalise on your data but your organisation might lack the skills to do so – this is where I can help, I’ve used data visualisation to improve a variety of businesses.
Using my experience of designing indicators to distil your organisation’s performance, I can provide you with a real-time automated dashboard designed to better understand progress, strategic links, and to enable data-led decisions.

Leave a comment